GBM options agent
Can the agent trade options it prices itself?
The agent prices one-month SPY options with a geometric Brownian motion model, forecasts volatility five ways, and buys or sells calls and puts under margin rules and a crash filter. Three training episodes, each tested out of sample from late 2021 on a $100k account.
How it works
- Model the price. GBM fitted by maximum likelihood, with diagnostics showing where fat tails and crashes break it.
- Forecast volatility. Historical, EWMA, GARCH(1,1), HAR-RV and VIX, refitted walk-forward and scored on the next 21 days.
- Price and verify. Monte Carlo with antithetic variates, checked against Black-Scholes; Greeks checked against finite differences.
- Find the edge. Compare the model’s expected payoff with the market price at implied volatility.
- Trade. Six actions: hold, buy or sell a call or put, close. Longs pay the ask, shorts collect the bid and post Reg-T-style margin.
- Control risk. At most six contracts and three naked shorts, forced buy-backs on margin calls, and a crash filter that blocks new shorts in falling, high-volatility markets.
Results
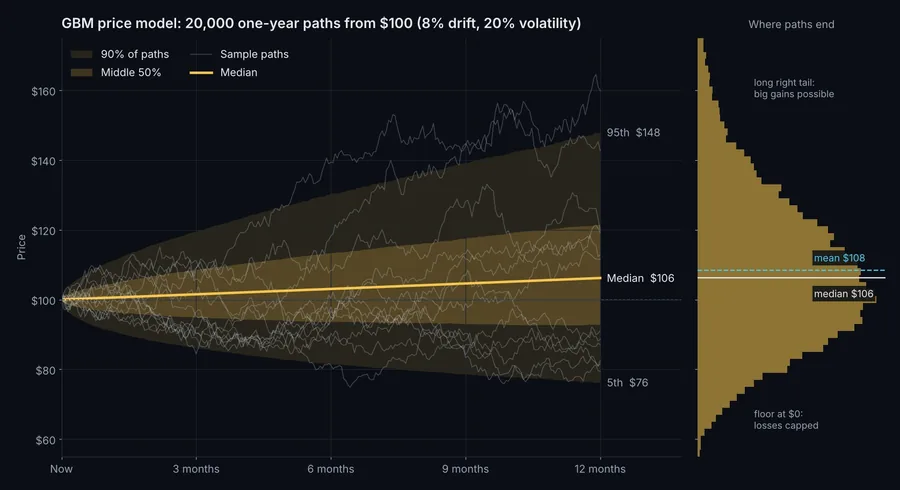
The price model
20,000 one-year paths from $100 at 8% drift and 20% volatility: 90% end between $76 and $148, the mean ($108) sits above the median ($106), and 38% still lose money.
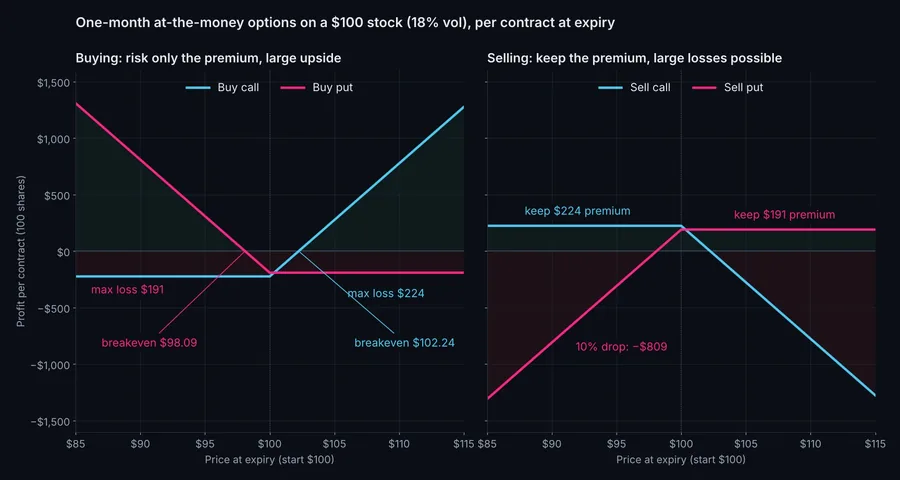
What it can trade
Buyers lose at most the premium ($224 call, $191 put at 18% volatility). Sellers keep it in calm markets, but a 10% drop costs a put seller $809, which is why selling comes with margin and a crash filter.
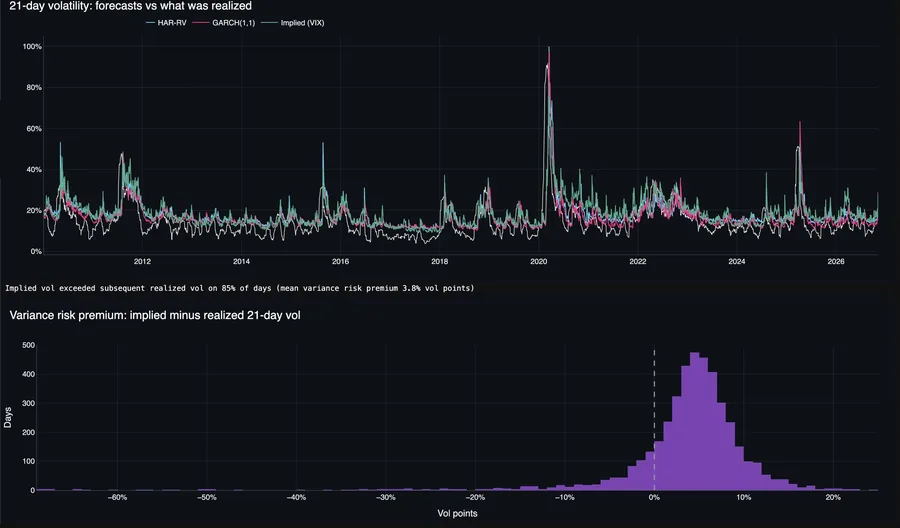
Options were usually priced for more volatility than arrived
HAR-RV, GARCH and VIX track every volatility spike from 2010 to 2026. Implied volatility exceeded what followed on 85% of days, by 3.8 points on average: the premium option sellers collect.
Three episodes, one lesson: training found the put seller
| Ep 1 | Ep 2 | Ep 3 | SPY | |
|---|---|---|---|---|
| Total return | −44% | +42% | +59% | +80% |
| CAGR | −10.9% | 7.1% | 9.6% | 12.4% |
| Volatility | 31.3% | 25.3% | 13.6% | 17.2% |
| Sharpe | -0.22 | 0.40 | 0.74 | 0.76 |
| Max drawdown | 65% | 43% | 20% | 25% |
| Trades · win rate | 293 · 41% | 321 · 59% | 168 · 79% | — |
Each episode is the same network saved at a later stage of training, run on the same unseen 2021–2026 data. Episode 1 mostly bought puts and sold calls (231 of 293 trades) and lost 44%. Episode 2 split between long calls (168) and short puts (151). Episode 3 sold only puts and was the best on every measure.
Episode 3 still trails SPY’s +80%, but with lower volatility and a smaller drawdown, for a Sharpe ratio close to the index’s.
| Position | Ep 1 | Ep 2 | Ep 3 |
|---|---|---|---|
| Short Put | 38 · +$3,458 | 151 · +$44,729 | 168 · +$59,033 |
| Short Call | 116 · −$5,475 | 2 · +$224 | — |
| Long Call | 24 · −$158 | 168 · −$3,327 | — |
| Long Put | 115 · −$42,070 | — | — |
| All | 293 · −$44,244 | 321 · +$41,627 | 168 · +$59,033 |
What it learned: sell puts
Trades and realized P&L by position. Short puts made money in every episode; long puts cost episode 1 $42,070. By the final episode the agent sold a put on every trade and won 79% of them: the variance risk premium at work.
The cost of selling shows in falling markets: September 2022, and the end of the test, when the last 3 puts lost $9,568 as SPY dropped. The trading desk replays every trade of all three episodes.
Takeaways
- Implied volatility usually runs high. Buying options tends to overpay; selling collects a premium for bearing crash risk.
- Training changes the strategy, not just the score. The same network went from −44% buying puts to +59% selling them across three episodes.
- Every number reconciles. In every episode, final account equity equals $100k plus the trade log’s P&L to the cent: +$59,033 in episode 3.
In the repository
View on GitHub: damion-m/Quantitative-Strategies
gbm_options_rl_agent.ipynboptions_dqn_ep1–3.kerasoptions_agent_trade_log_ep1–3.csvoptions_agent_equity_ep1–3.csvgbm-options-rl-agent-design.mdfunc_lib.py