Regression strategies
Can simple models predict tomorrow’s direction across the S&P 500?
My starting point: five models turn the recent momentum of every S&P 500 stock into a daily long-or-cash decision. Each becomes a strategy and is tested out of sample from September 2018 against holding every stock equally.
How it works
- Data. Daily prices for S&P 500 stocks since 2000, turned into 1-, 5-, 15- and 20-day returns, with the next day’s return as the target.
- One honest split. The first 70% of dates train every model and the last 30% test them. Features are scaled on training data only.
- Date-ordered validation. Cross-validation folds are cut by date, so no model ever trains on days after the ones it is scored on.
- Five models. Linear regression and Lasso forecast the return; logistic regression and two decision trees forecast the chance of an up day.
- Strategy rule. Hold a stock when its forecast is positive (or P(up) > 50%), otherwise stay in cash; average across stocks each day.
Results
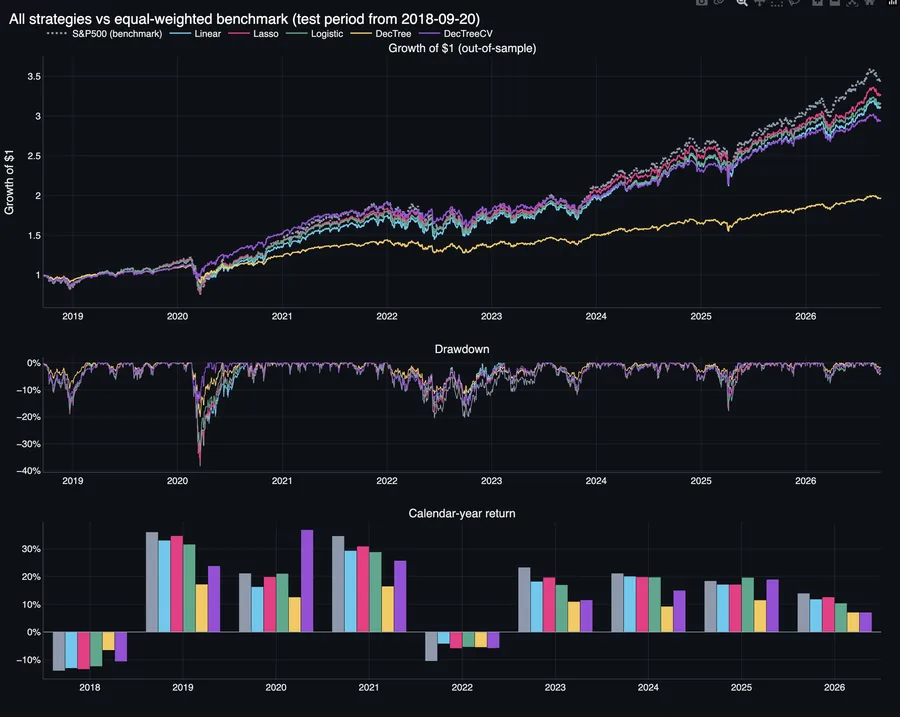
No model beat the benchmark
Growth of $1 (top), fall from peak (middle) and calendar-year returns (bottom). Grey dotted is the equal-weighted benchmark.
- Growth: benchmark about $3.45; Lasso about $3.27, logistic and linear about $3.10–3.15, tuned tree about $2.93, unpruned tree about $1.97.
- Downturns: all fell 35–40% in March 2020. In 2022 the strategies lost about 4–6% against the benchmark’s 10%, because they sat in cash on some down days.
- Best year: the tuned tree’s 2020, about 37% against 21%.
Dollar values are read from the chart.
| Metric | Linear | Lasso | Logistic | Decision tree | Tuned tree |
|---|---|---|---|---|---|
| Type | Regression | Regression | Classifier | Classifier | Classifier |
| Hit rate | 52.0% | 52.1% | 52.0% | 50.1% | 51.5% |
| ROC-AUC | 0.509 | 0.509 | 0.510 | 0.501 | 0.509 |
| Rank IC | 0.020 | 0.020 | 0.022 | 0.001 | 0.014 |
| Time long | 86% | 90% | 84% | 51% | 69% |
Barely better than a coin flip
Hit rate is how often the direction was right; ROC-AUC and rank IC measure ranking skill, where 0.5 and 0 mean none; time long is the share of stock-days held.
Lasso came closest to the benchmark because it stayed long 90% of the time, not because it predicted better. The unpruned tree had no skill and was long only half the time, hence its $1.97.
Takeaways
- Daily direction is mostly noise. Hit rates of 50–52% and AUCs near 0.51 from momentum alone.
- Time in the market decides results. In a rising market, the strategy that stays invested longest tracks the benchmark best.
- Discipline carries forward. Date-ordered splits and one shared backtest became the standard for every later project.
In the repository
View on GitHub: damion-m/Quantitative-Strategies
regression_models_comparison.ipynblogistic_regression.ipynblasso_regression.ipynbfunc_lib.py